Debugging maya python from VS code, how do I use debugpy?

image
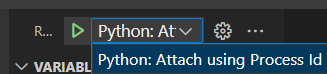
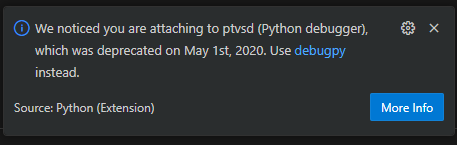
I’m having an issue trying to set up vs code for maya, it says I’m using ptvsd for debugging, but I cannot figure out how to switch to debugpy
I tried to use ptvsd in maya, and the first time I run a script it works, but subsequent attempts fail
I’m new to VS code, so its probably something simple haha, I’m switching from pycharm :upside_down_face:

this is my launch.json configuration, I was following Debugging in Maya with debugpy and VSCode - Aleksandar Kocic | Pipeline TD

    {
      "name": "Python Attach",
      "type": "python",
      "request": "attach",
      "port": 5678,
      "host": "127.0.0.1",
 
    }

and I tried Debugging Maya using Visual Studio Code for ptvsd

I would prefer to get the debugpy version working since ptvsd is deprecated

please help! and thank you!!!

What is the code you are running in Maya to enable debugpy?

    // Use IntelliSense to learn about possible attributes.
    // Hover to view descriptions of existing attributes.
    // For more information, visit: https://go.microsoft.com/fwlink/?linkid=830387
    "version": "0.2.0",
    "configurations": [
        {
            "name": "Python: Attach using Process Id",
            "type": "python",
            "request": "attach",
            "processId": "${command:pickProcess}",
            "justMyCode": true
        }
    ]
}

I use this in my launch.json. Then in the Debug and Run section of VsCode I select the Attach using Process Id in the dropdown
image
Hit the run button or F5 and it should give you a new dropdown, type in maya (obviously you have to have maya running already)

I do find that sometimes it doesn’t connect straight away and I need to swap back and forth between maya and vscode to get it to connect. But after that you can just use break points as you would in VStudio. No need to have ptsv or debugpy (at least in my exp as I haven’t got debugypy directly)

    {
      "name": "Python Attach",
      "type": "python",
      "request": "attach",
      "port": 5678,
      "host": "127.0.0.1"
    }

this, just like in here Debugging in Maya with debugpy and VSCode - Aleksandar Kocic | Pipeline TD

You need debugpy to be running in Maya and have it listen to your port for VScode to connect

You need to install debugpy, you can use Max’s python to pip it or download a separate version and add the location to your PATH then in DCC run with your port number swapped out:

Ah you need to install debugpy, you can use Max’s python to pip it or download a separate version and add the location to your PATH then in DCC run with your port number swapped out:

import debugpy
 
# Allow other computers to attach to debugpy at this IP address and port.
debugpy.listen(('1.2.3.4', 5678))
 
# Pause the program until a remote debugger is attached
debugpy.wait_for_client()

oh sorry!, I misread your question!!

my code in maya was this

import os
import debugpy
mayapy_exe = os.path.join(os.environ.get("MAYA_LOCATION"), "bin", "mayapy")
debugpy.configure(python=mayapy_exe)
debugpy.listen(5678)

I have followed the post Debugging in Maya with debugpy and VSCode - Aleksandar Kocic | Pipeline TD , I downloaded debugpy, placed it in a PATH folder for maya, and the code runs with no errors

this gives me that issue in vs code where it tells me I’m trying to attach to ptvsd for some reason

I tried the code you suggested as well

import debugpy
debugpy.listen(('1.2.3.4', 5678))
debugpy.wait_for_client()

this gives me an error in maya

\site-packages\debugpy\server\api.py line 262: Can't listen for client connections: [WinError 10049] The requested address is not valid in its context

hey! thanks for your suggestion!, this also is doesn’t work for me, I think it might be a related issue, is like the debugger doesn’t start, the buttons to step over, step into and step out are grayed out, I am very confused as to why this isn’t working!!

Just to be clear, you need to use your actual (local) ip address, or loopback/localhost, or 0.0.0.0:

import debugpy

debugpy.listen(('localhost', 5678))  # listen on loopback/localhost, safest option if you want to keep it local to your machine
# debugpy.listen(('127.0.0.1', 5678))  # can be considered equivalent of the above

# The following ones are a bit more risky, as they may open this port to the network; 
# an attacker could exploit this if they had access to the network
# debugpy.listen(('192.168.1.2', 5678))  # if 192.168.1.2 is the IP of the machine you want to connect to
# debugpy.listen(('0.0.0.0', 5678))  # it will bind to whatever IP your machine has; allowing localhost as well as ip connections

debugpy.wait_for_client()

Then VSCode config for a remote attach could look like this:

{
    "name": "Python: Remote Attach",
    "type": "python",
    "request": "attach",
    "port": 5678,
    "host": "127.0.0.1",
    "justMyCode": true
}

Or you could use this for host:

"host": "localhost",

Alternatively, if you’re using an exact IP, you can enter it explicitly:

"host": "192.168.1.2",

It’s a far shot, but perhaps you’re using an old version of VS Code? It’s not recommended, but in that case you could try using the ptvsd package instead of debugpy. You would need to install ptvsd package, and afterwards the usage is quite similar:

import ptvsd
ptvsd.enable_attach(('localhost', 5678))
ptvsd.wait_for_attach()
ptvsd.break_into_debugger()

If the pause button is available, try that. It could just mean you didn’t set any breakpoints.

Hey! thank you! this helped!!!
I reinstalled vs code and the ptvsd warning went away, and I could connect with the debugpy code